Snowplow Analytics Debugger
Here I write about building a chrome extension for Igloo Analytics that helps people debug their Snowplow Analytics implementation.
You can view this extension in Chrome Web Store here: Snowplow Analytics Debugger

About Igloo Analytics
Igloo Analytics is an agency that helps organizations use analytics data for greater efficiencies, growth, and innovation. They specialize in Digital Analytics Strategy, Tag/Data Management, Digital Analytics Implementation and Snowplow Analytics. You can check them out here: Igloo Analytics - Analytics Experts.
They contacted me with an idea for a chrome extension that would solve a problem in their niche, and together we developed a creative and useful tool :) You can install it here: Snowplow Analytics Debugger
About Snowplow Analytics
Snowplow Analytics is a data collection platform similar to Google Analytics. The difference is that you have to install Snowplow on your cloud, which allows you to own all your data. Then, whenever there is an event or a pageview on your website - Snowplow will send an HTTP request to your servers which will analyze and store the data about user behavior.
The problem
If you open the Network tab in chrome devtools and inspect a Snowplow HTTP request, it will look something like this:
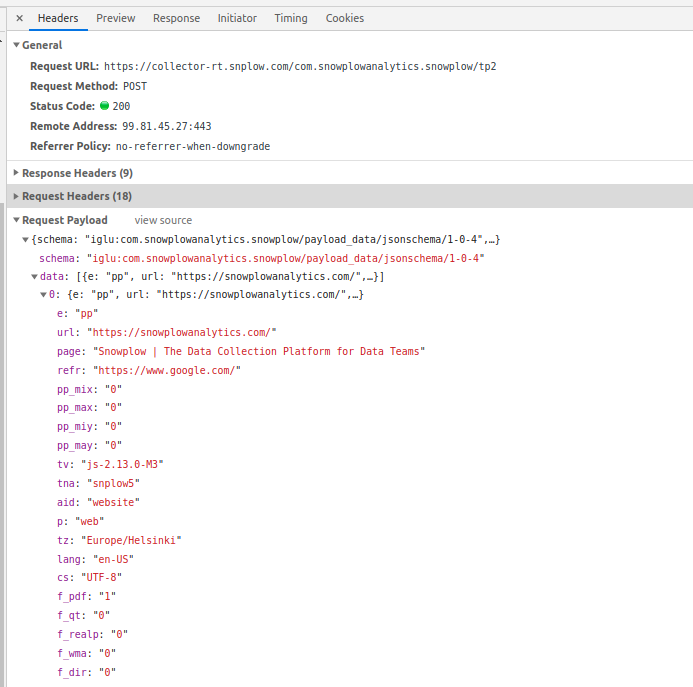
e: "pp" means that the event type is "Page Ping", tna stands for "The tracker namespace", f_pdf: "1" means that the PDF plugin is installed.
Snowplow implemented these shortcuts in order to make the HTTP payload as small as possible. e: "pp" will travel over the network faster than Event Type: "Page Ping".
You can see that this is very confusing and impossible to understand for a human without remembering all the shortcuts. People needed a tool to help them inspect and debug these network requests in a comfortable way.
The solution
Snowplow published a document where they describe exactly what those shortcuts mean and what they should be mapped to here: Snowplow Tracker Protocol. It looks something like this:

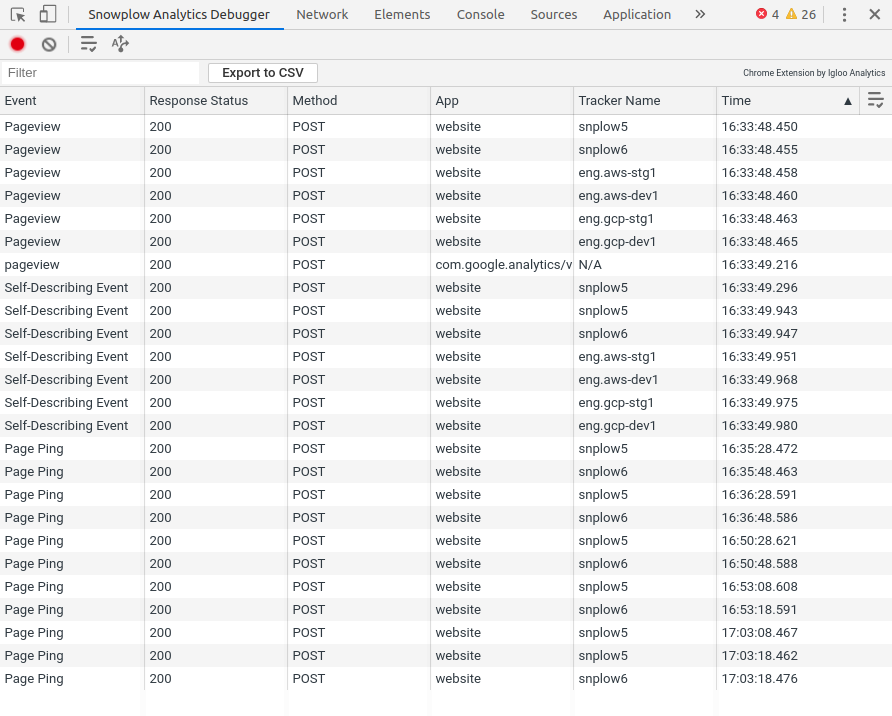
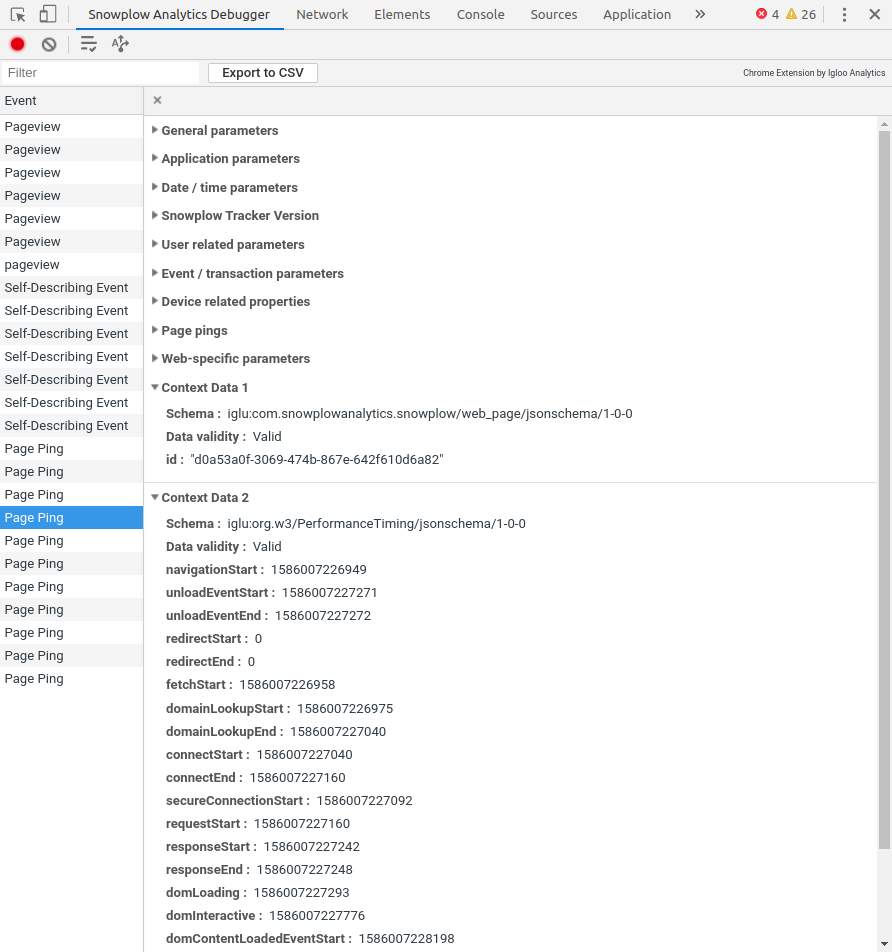
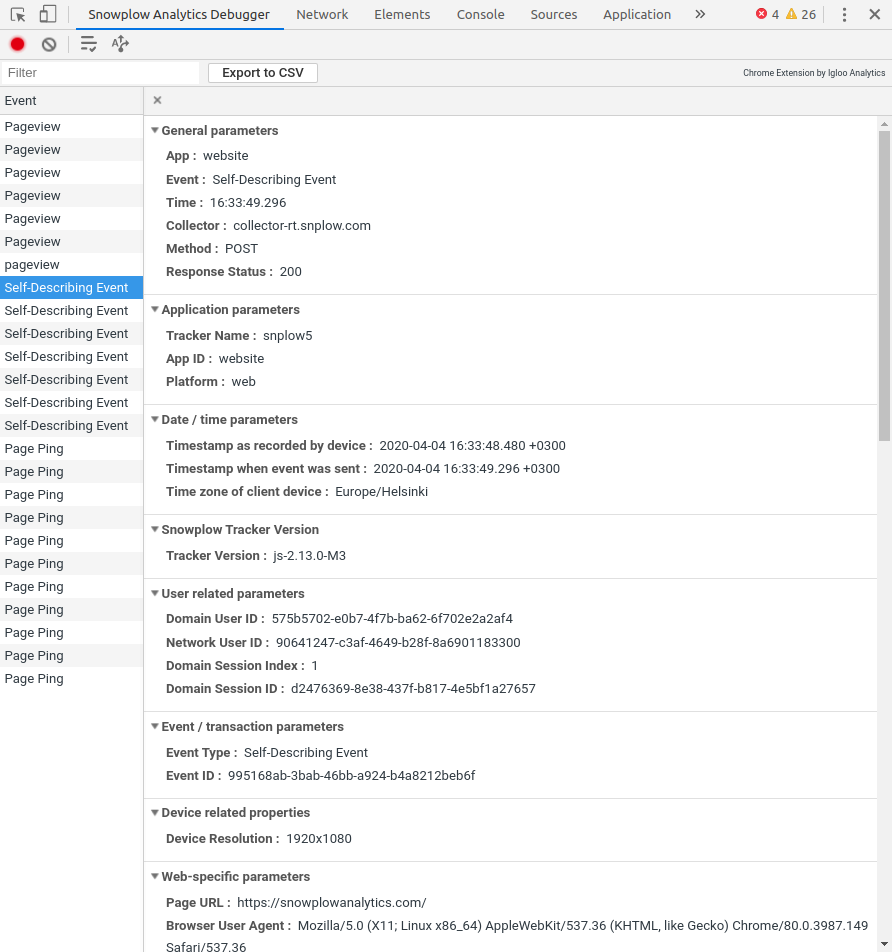
So the solution to the problem was building a simple DevTools extension that would open near the Network tab. It would contain detailed unminified information about the Snowplow HTTP request.
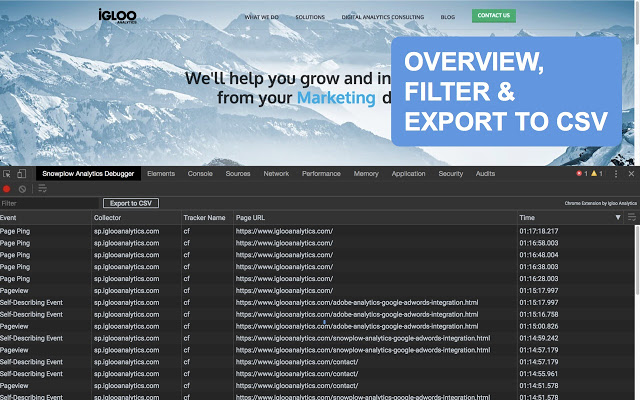
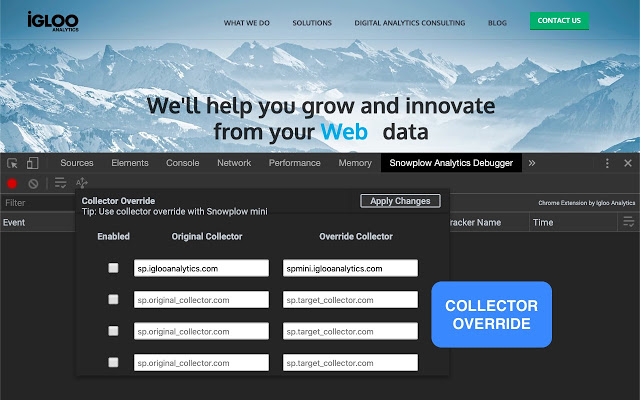
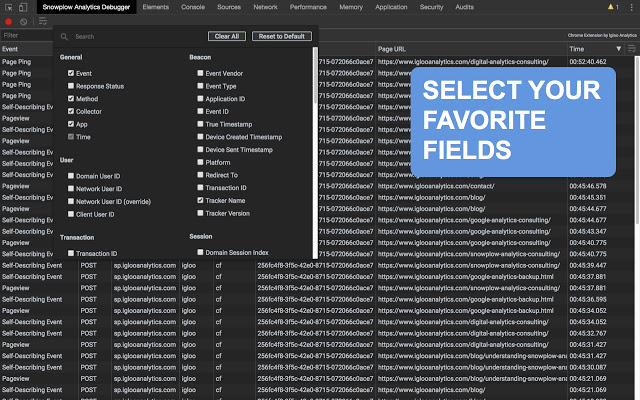
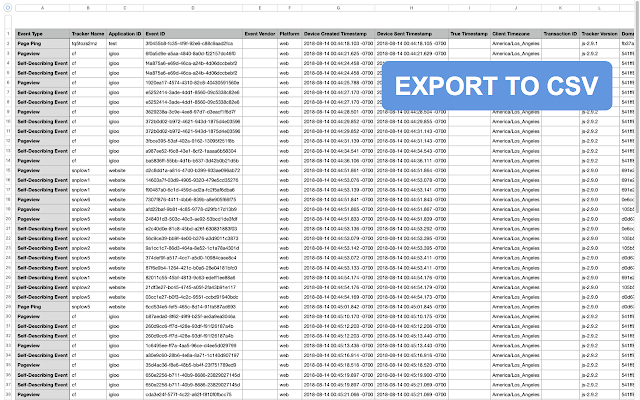
Building a seamless user interface
After some consideration about how the extension should look and feel - we decided to build a UI similar to the native network inspector from Chrome DevTools. It would solve all our needs and users would be already familiar with the UI, so it would be automatically easy to use :) Here are a few screenshots of how it looks:
It even has a dark theme, that is activated when a user changes his DevTools theme:

Conclusion
I liked working on this chrome extension a lot. The best software is the one that solves real problems. I learned the importance of using something already made and working instead of reinventing the wheel :)
